ILKAL CO-OPERATIVE BANK LTD.
Serving the Community Since 1965
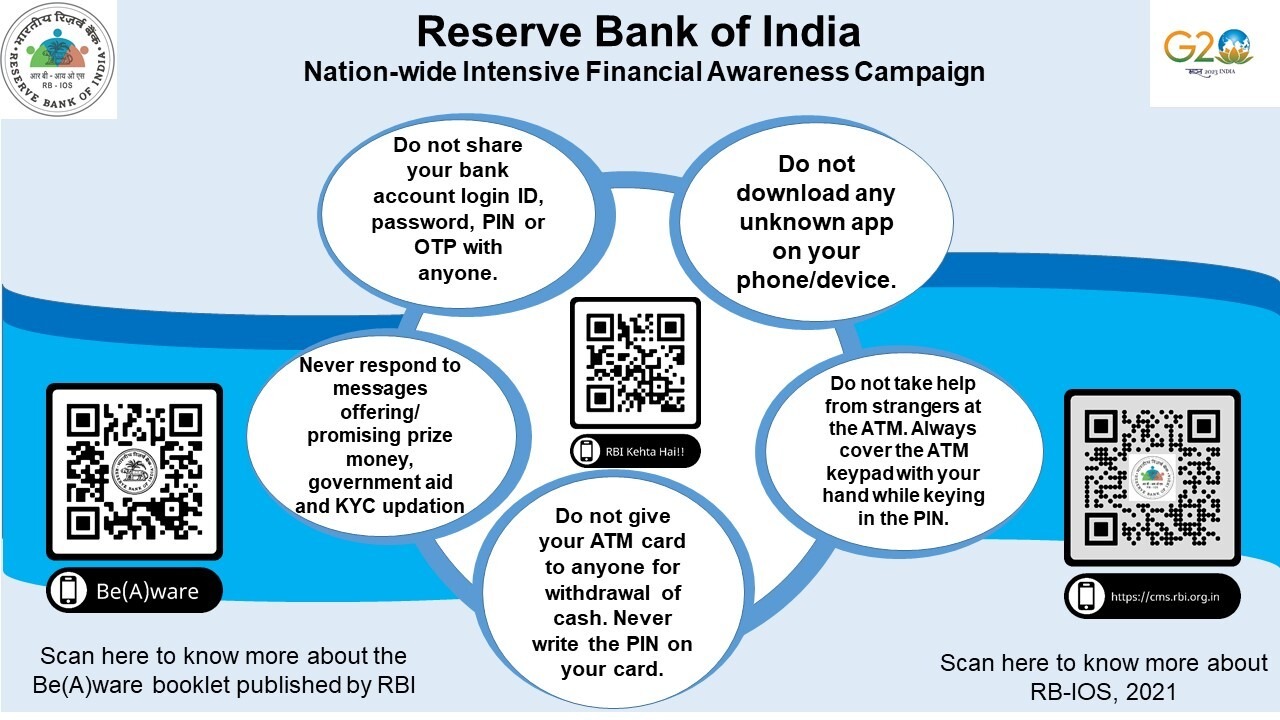
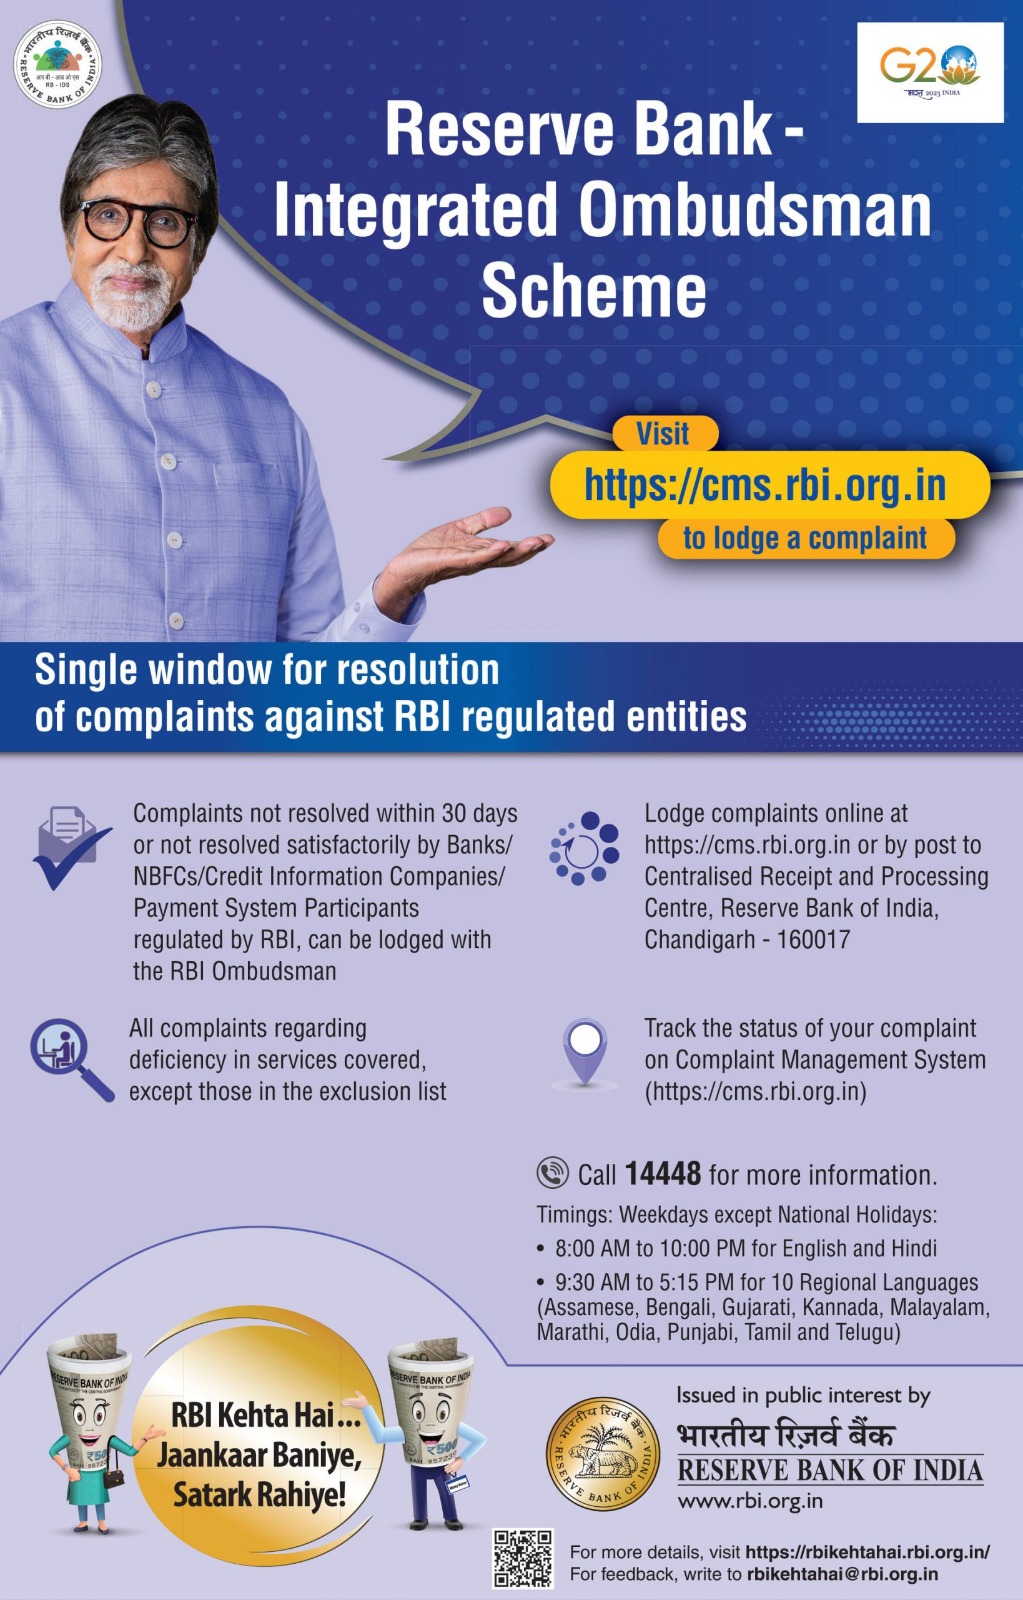
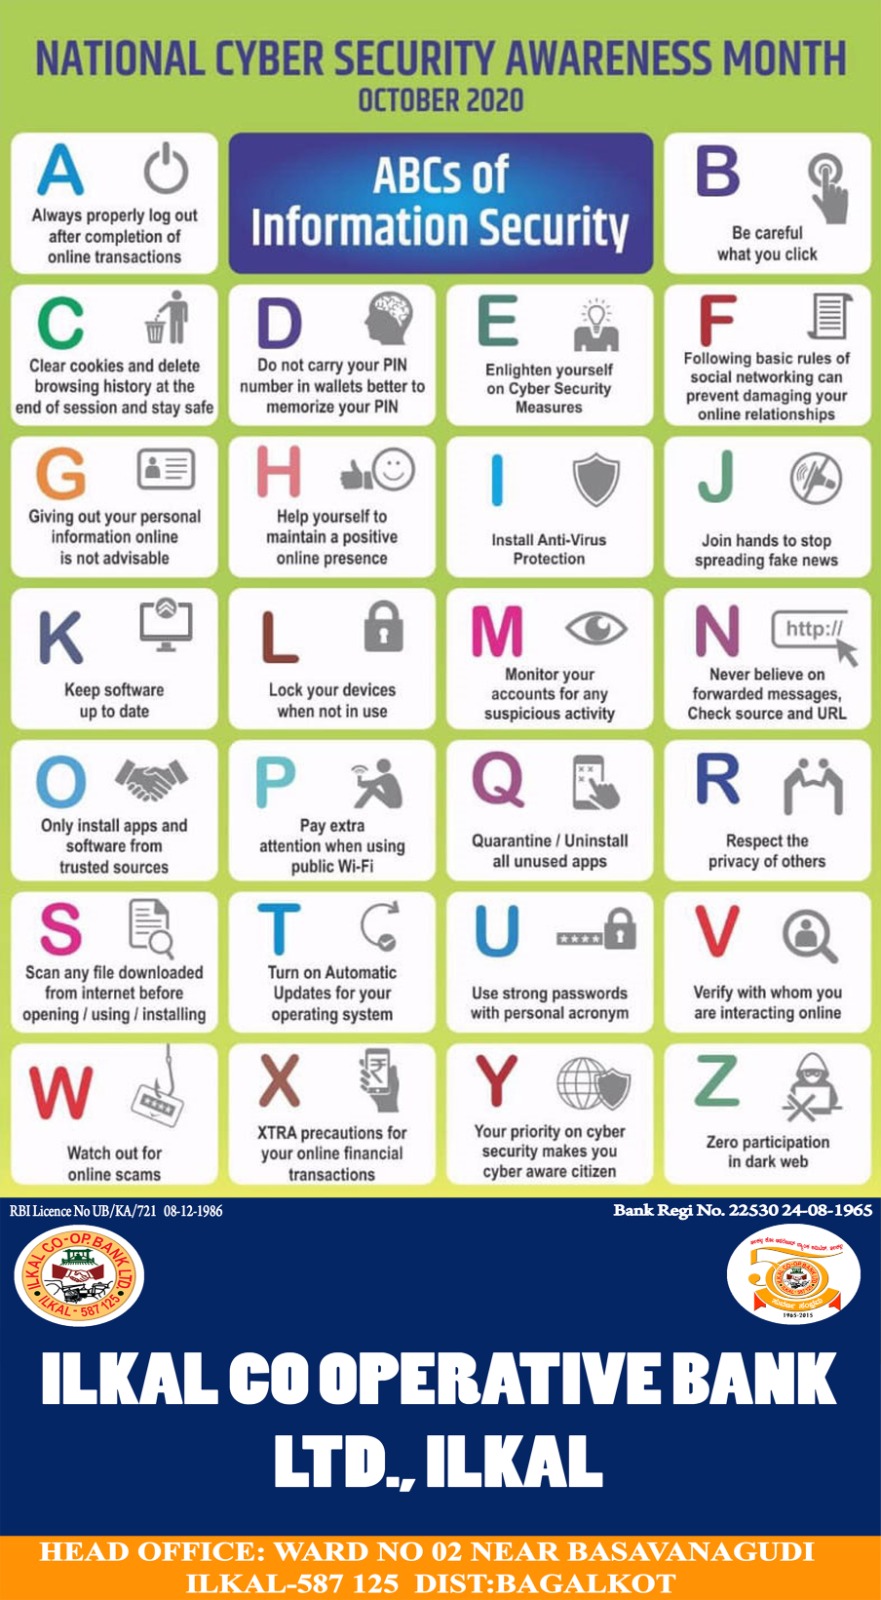
⚠️
Awareness Notice
Customers are advised to stay alert against cyber frauds. Do not share your OTP, PIN, passwords, or card details with anyone.

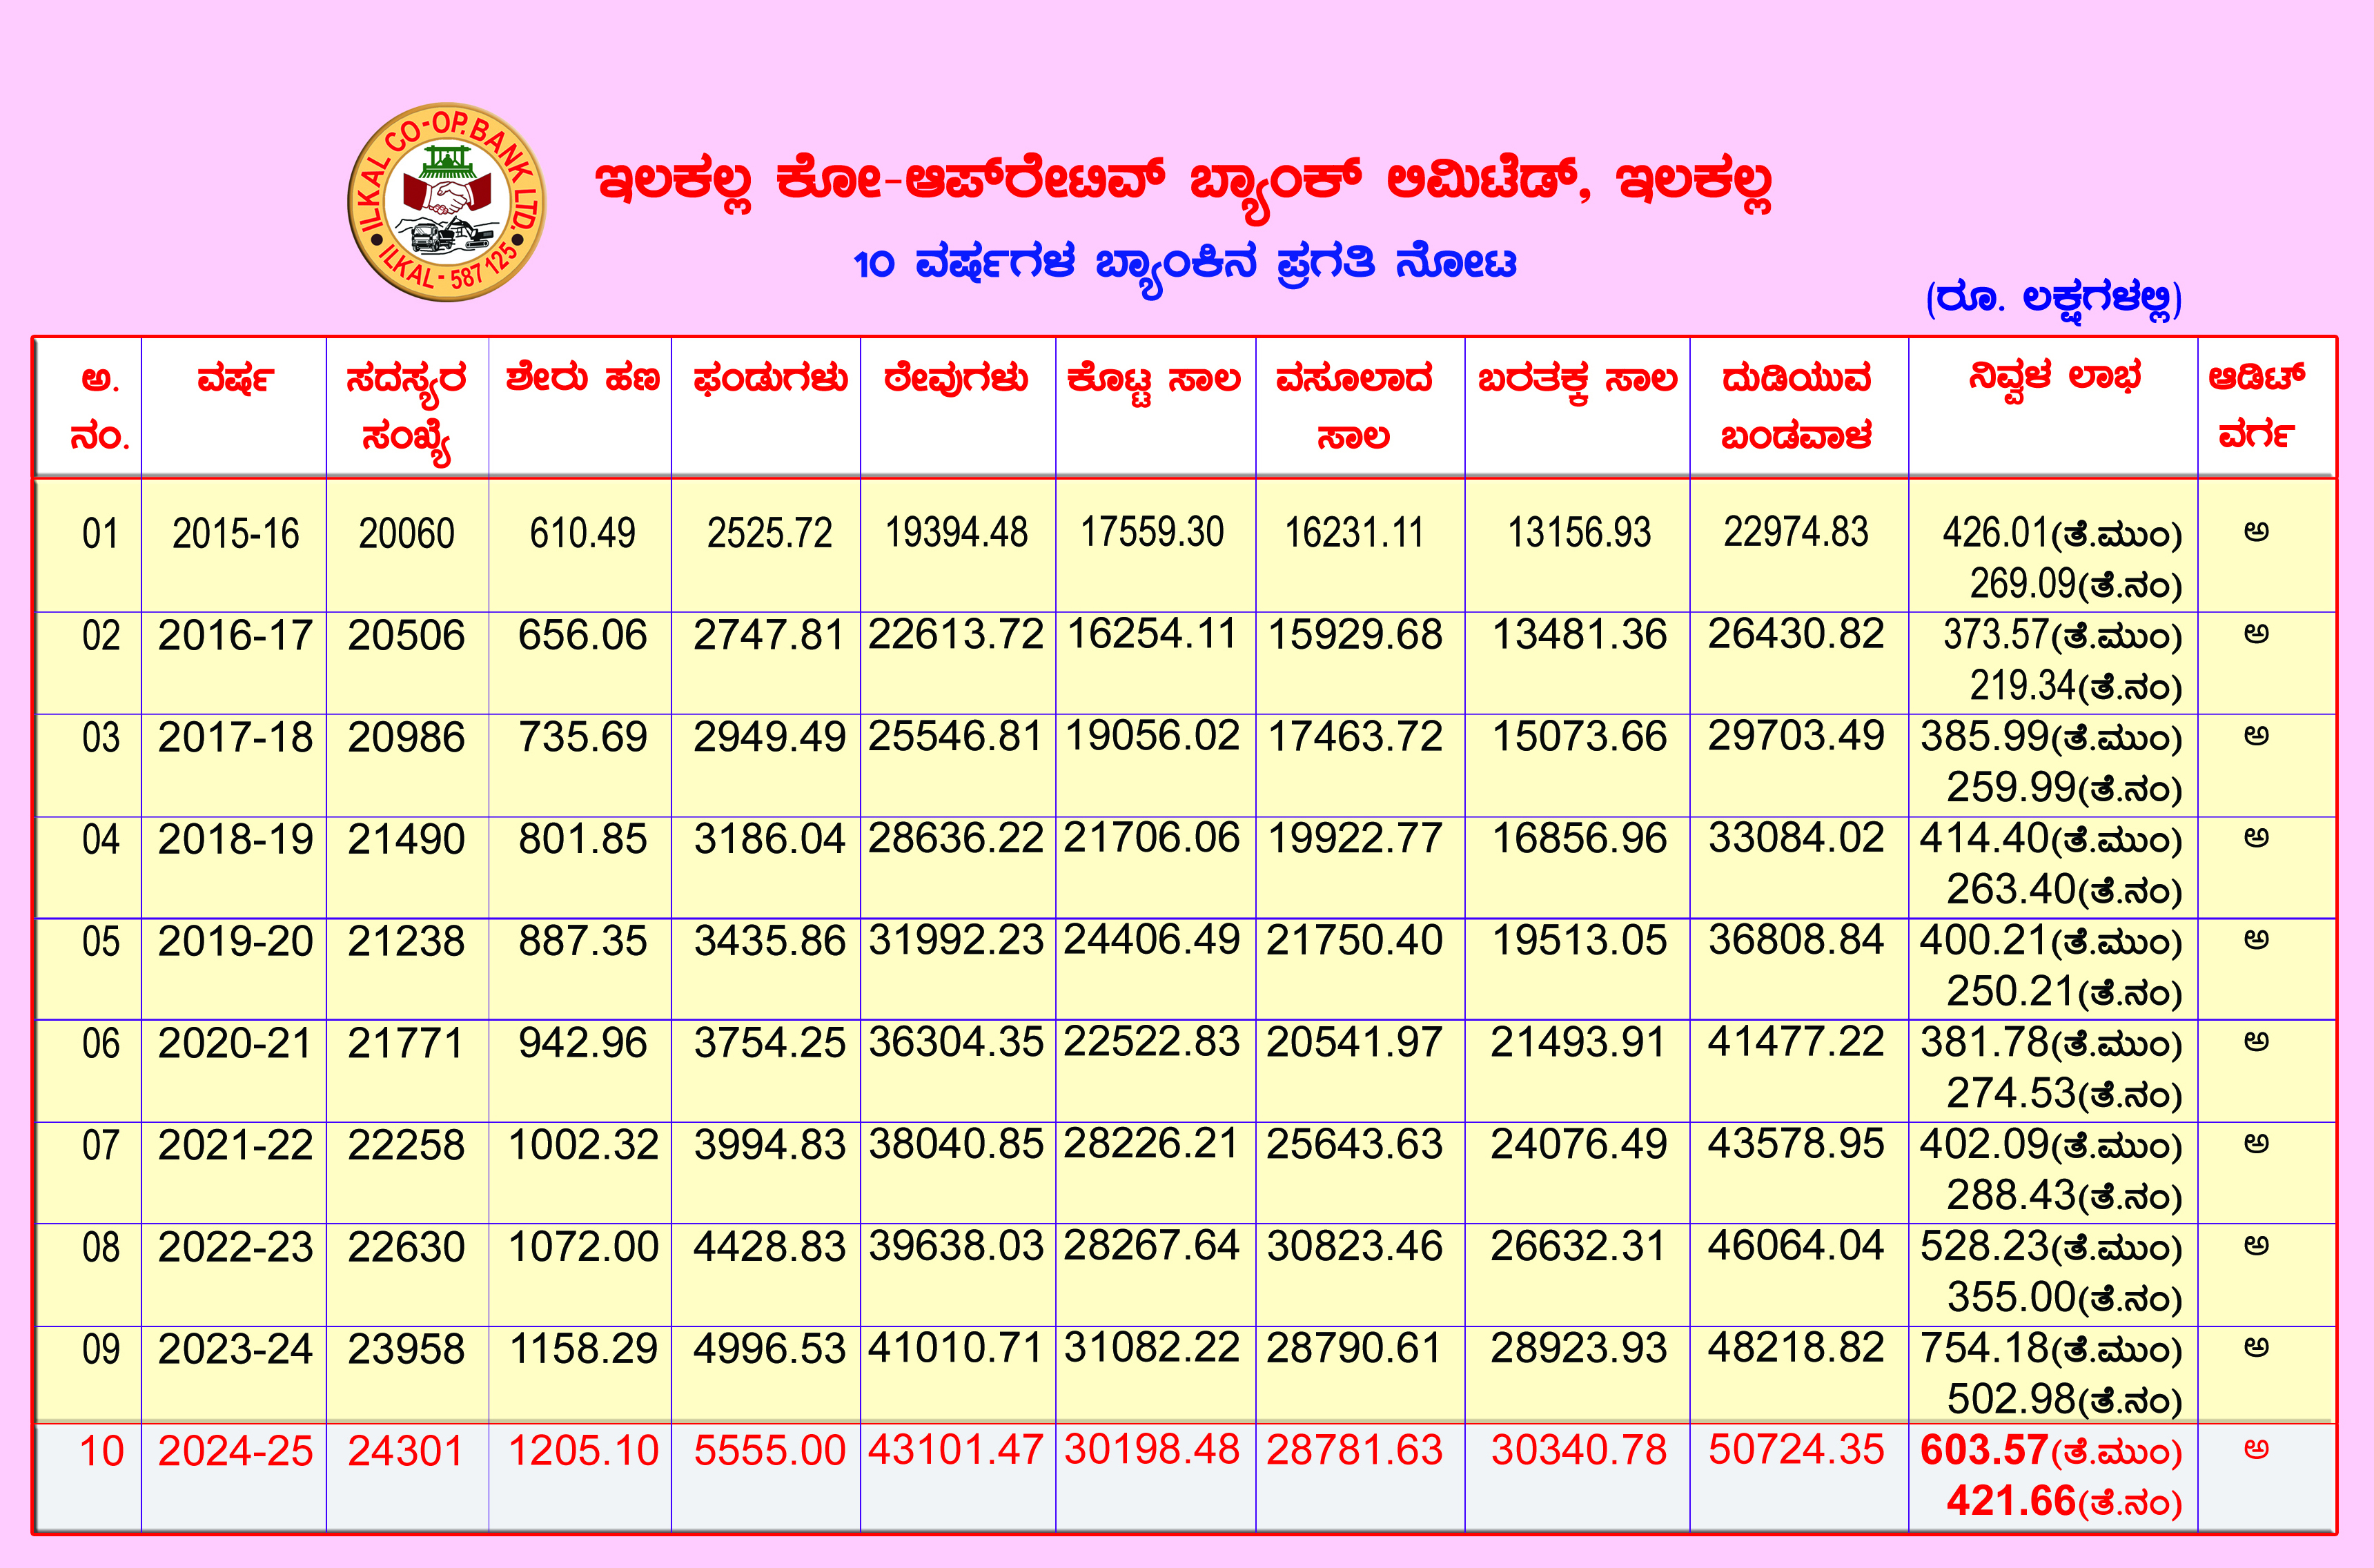
10 Years Bank Performance
Financial growth overview
| Year | Members | Total Deposits (₹ in Lakhs) | Total Loans (₹ in Lakhs) | Net Profit (₹ in Lakhs) |
|---|---|---|---|---|
| 2015-16 | 20060 | 19394.48 | 17559.3 | 426.01 |
| 2016-17 | 20506 | 22613.72 | 16254.11 | 373.57 |
| 2017-18 | 20986 | 25546.81 | 19056.02 | 385.99 |
| 2018-19 | 21490 | 28636.22 | 21706.06 | 414.4 |
| 2019-20 | 21238 | 31992.23 | 24406.49 | 400.21 |
| 2020-21 | 21771 | 36304.35 | 22522.83 | 381.78 |
| 2021-22 | 22258 | 38040.85 | 28226.21 | 402.09 |
| 2022-23 | 22630 | 39638.03 | 28267.64 | 528.23 |
| 2023-24 | 23958 | 41010.71 | 31082.22 | 754.18 |
| 2024-25 | 24301 | 43101.47 | 30198.48 | 603.57 |
Visual Performance Summary
10 Years Financial Performance
*This chart is provided for reference and transparency.